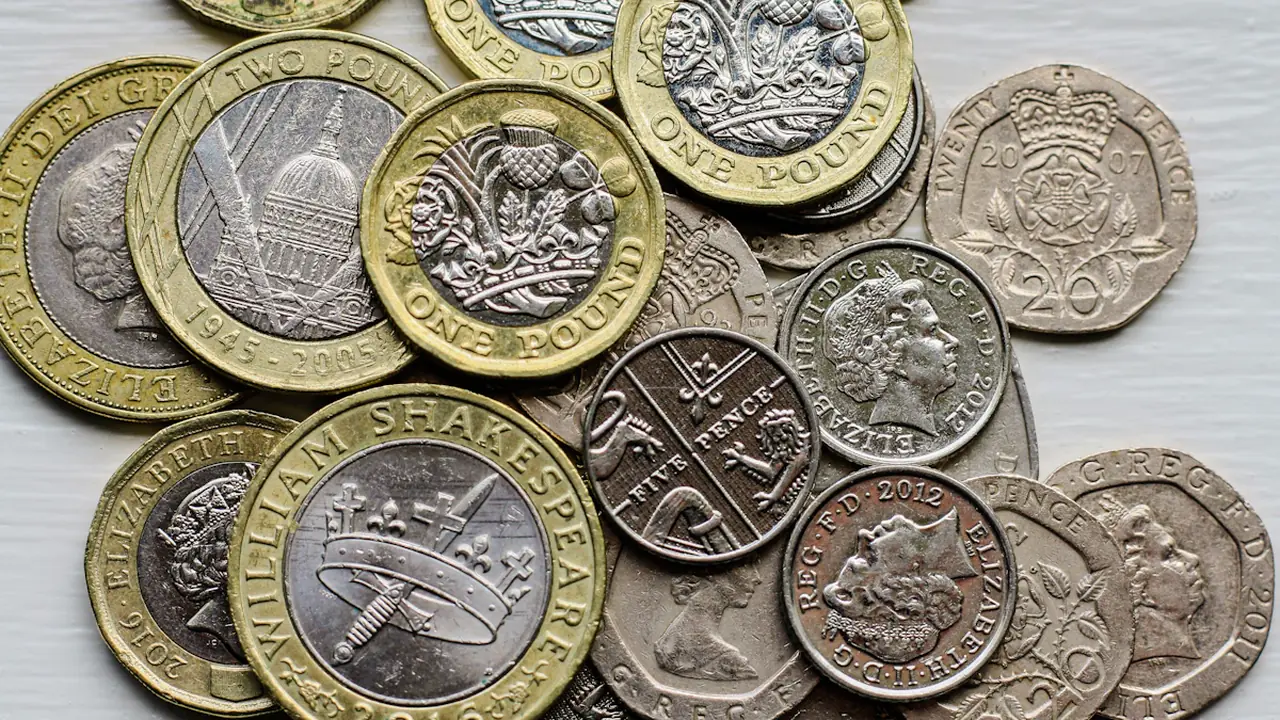
The Office for National Statistics has scheduled its July 2026 UK consumer-price inflation release for 19 August 2026. The headline figure will matter to households already balancing food, energy, housing and transport costs, while the publication date sets the deadline for deciding whether inflation reaches the forecast threshold of 3.5%.
By the GlobeBids Economy Desk — 14 August 2026
The July inflation forecast at a glance
- The question is whether July’s all-items CPI 12-month rate will be 3.5% or higher.
- The ONS is scheduled to publish the result on 19 August 2026.
- YES requires an initially reported rate of at least 3.5%.
- NO requires an initially reported rate below 3.5%.
- The ONS July 2026 consumer-price inflation release will determine the outcome.
This is a test of one precisely defined national statistic, not a prediction about whether every household’s bills will rise by the same amount. The result will also offer a fresh signal about purchasing power, wage growth in real terms and expectations for future borrowing costs.
Why the 3.5% threshold matters to household finances
A July CPI rate at or above 3.5% would show that the average price level covered by the index remained substantially above its level a year earlier. For households, persistent inflation can mean that earnings and savings must grow more quickly simply to preserve their spending power.
The YES path does not require inflation to rise from the preceding month’s annual rate. It requires only that the ONS initially reports July’s all-items CPI 12-month rate as 3.5% or higher. Inflation could slow and still produce a YES result if it remains on or above that line.
The NO path is equally clear. Any initially published rate below 3.5%, including 3.4%, would resolve the forecast as NO. That outcome would indicate a lower annual inflation rate than the threshold, but it would not necessarily mean that household prices had fallen.
The available source evidence establishes the publication date and the institution responsible for the result. It does not establish the July figure in advance, so neither outcome should be treated as known before the release.
What the Consumer Prices Index actually measures
The Consumer Prices Index measures average price changes across a representative basket of goods and services purchased by households. The basket and the weights assigned to its components are designed to reflect spending patterns across the economy rather than the exact budget of one family.
That distinction is important. A national CPI rate of 3.5% would not mean that every item had become 3.5% more expensive, or that every household had experienced precisely that increase. Some prices may rise rapidly, others may change little and some may decline.
Why personal inflation rates differ
A household’s experience depends on where its money goes. Someone who spends a large share of income on a category with unusually strong price growth may feel more pressure than the national headline suggests. Another household with different housing, transport or food needs may experience a smaller increase.
The headline rate is therefore best understood as a consistent national benchmark. It allows changes over time to be compared, but it cannot reproduce every household’s personal cost-of-living pattern.
The spending categories that could move July CPI
The headline number will be accompanied by category-level detail. Readers can use those figures to see whether July’s movement was broad-based or concentrated in a smaller number of household expenses.
Important areas to examine include:
- Food and non-alcoholic beverages, which affect frequent household purchases.
- Housing-related costs, including household energy components represented in CPI.
- Transport, where fuel prices, air fares and other services can move differently.
- Restaurants and hotels, reflecting prices in hospitality and accommodation.
- Recreation, culture, clothing and footwear.
- Other services, where labour and operating costs can influence prices.
The contribution of a category depends on both its price movement and its weight in the CPI basket. A sharp increase in a relatively small component may have less effect on the headline rate than a modest rise in a category that represents a larger share of typical spending.
Month-to-month comparisons also require care. Some prices follow seasonal patterns, and the annual rate compares July 2026 with July 2025. A change in the annual figure can therefore reflect what happened in both periods, not just a sudden shift during the latest month.
Lower inflation would not automatically mean lower prices
Falling inflation and falling prices are different outcomes. If the annual CPI rate drops from 3.6% to 3.4%, the average price level is still higher than a year earlier; it is simply rising at a slower annual pace.
Broad price declines would instead be described as deflation when sustained across the index. A lower positive inflation rate can ease the speed at which household costs increase, but it does not reverse the cumulative price rises already built into grocery bills, services or other expenses.
This distinction affects how the July release should be interpreted. A NO result could represent welcome moderation without delivering an immediate reduction in the cash amount families need for regular purchases. A YES result could reinforce concern that cost pressures are proving persistent, even if individual categories show mixed movements.
Wages and savings will shape the real household impact
Inflation changes what a given amount of income can buy. The practical effect on workers depends partly on whether their pay is increasing faster or slower than consumer prices.
If nominal wages rise faster than inflation, real purchasing power can improve before taxes and personal circumstances are considered. If wage growth trails inflation, households may be able to buy less even though their cash pay has increased. The CPI release alone cannot settle that comparison; wage data and each household’s spending mix also matter.
Savings face a similar calculation. The advertised interest rate on an account is a nominal return. What matters for purchasing power is the return after inflation, as well as tax where applicable. A saver receiving 3% interest while prices rise by 3.5% would see the real value of those savings eroded before other factors are considered.

Households should avoid treating one national CPI reading as a personalised financial forecast. Existing mortgage terms, rental agreements, debt balances, savings products and income changes can have a much larger immediate effect on an individual budget.
What July CPI could signal for borrowing costs
The Bank of England’s inflation guidance explains the role of inflation in household finances and identifies the UK’s 2% inflation target. Inflation data consequently influences expectations about Bank Rate, which can feed through to mortgages, loans and savings products.
A result at or above 3.5% could encourage expectations that restrictive borrowing conditions may need to persist, particularly if underlying category data also points to durable price pressure. A reading below the threshold could support hopes that inflation is moderating.
Neither result would mechanically determine the next Bank Rate decision. Policymakers consider a wider set of information, including wage growth, services inflation, economic activity and the outlook for future price pressures. Financial providers also set customer rates using funding costs, competition, risk and product-specific considerations.
For borrowers, the July release is therefore a signal rather than a promise of an immediate mortgage or loan-rate change. For savers, lower inflation could improve the real value of a given interest return, but deposit rates may also change as expectations for Bank Rate evolve.
How the official result will be judged
The forecast resolves YES if the ONS initially reports the July 2026 UK all-items CPI 12-month rate as 3.5% or higher. It resolves NO if that first official figure is below 3.5%.
The initial publication controls the outcome. Later revisions will not reopen or change it. This prevents the judgment from shifting after the scheduled release and keeps both paths tied to the same public evidence.
If the release is delayed, the forecast remains pending only through 26 August 2026. A publication delayed beyond that date is treated as unresolved or void rather than being inferred from another inflation measure, a media estimate or a later statistical release.
On 19 August, readers should check three parts of the ONS publication: the all-items CPI 12-month rate, the category contributions behind any change and the wording identifying the figure as covering July 2026. Together, those details will reveal both the binary result and what it means for household costs.
Source: Office for National Statistics
Context & actions About this article
Source check How the forecast is resolved
The outcome depends exclusively on the first July 2026 all-items CPI 12-month rate published by the ONS.
- Confirm that the ONS release covers July 2026.
- Check whether the all-items CPI 12-month rate is at least 3.5%.
- Use the initially published figure rather than a subsequent revision.
- Treat publication after 26 August 2026 as unresolved or void.
- Source
- Office for National Statistics
- Scope
- United Kingdom
- Updated
- 2026-08-14 19:22
Source check
Report a trust issue
Send a clear signal to community moderation if the source, facts or context need review.



Comments